VWAP Volatility
Infinite Equity is introducing innovative new thought leadership on the financial theory around determining historical volatility for purposes of ASC718. Introduced in the Research Brief, A New Way to Estimate Historical Volatility, and published collectively at www.VWAPVolatility.com.
The intent of this Research Brief is to study closing prices compared against the tick-by-tick transaction data during a given day, ranging from August 20, 2020 to March 3, 2021 (representing 133 trading days). We chose to study the Dow 30 for this research, as they are 30 of the largest public companies in the United States, and there is no risk of any thinly traded securities within this cohort.
Theoretically, the closing price in a liquid market would represent just another transaction and would be just as likely to land on the high end as it would be on the lower end. When studying a large sample size, we anticipate it to be near the median; however, that is not what the results show.
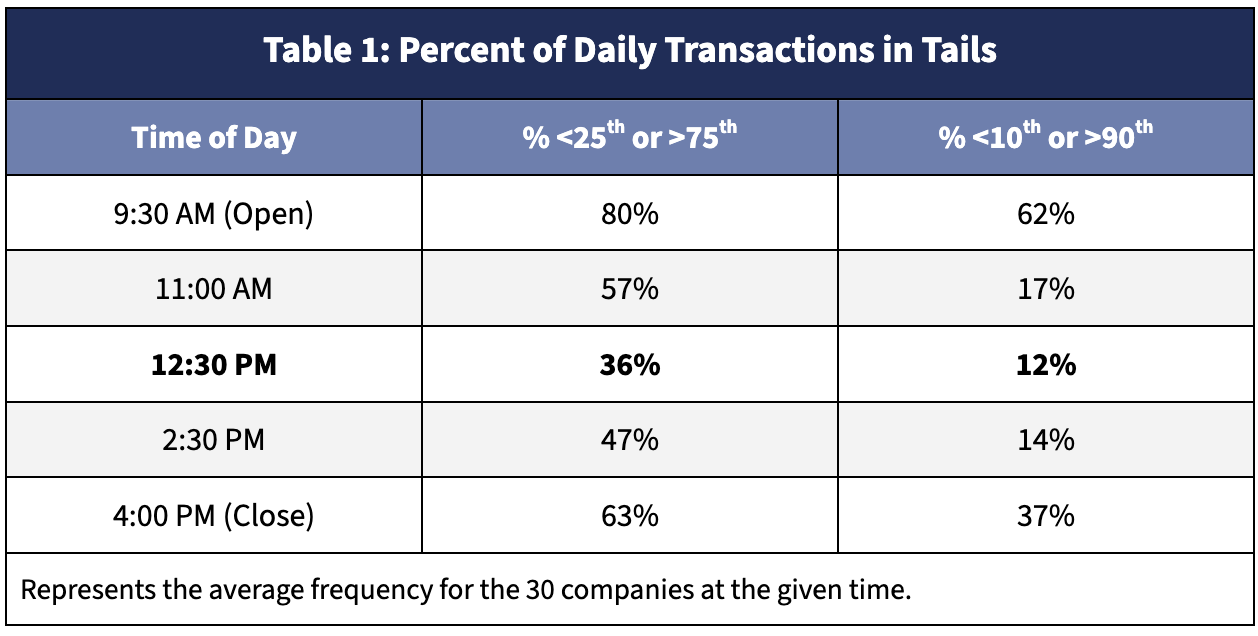
The following Table 1 summarizes 5 distinct moments of a day (ranging from the opening price at 9:30 AM to the closing price at 4 PM. We have illustrated at what percentile the trade at that time was as compared to all trades during a given day. Note that the closing price lands in the top or bottom decile (the top or bottom 10% of trades during the day) 37% of the time (as opposed to the 20% you would anticipate in a uniform distribution).

This signifies that the closing price occurs at an extreme (either the extreme quartiles or deciles) a disproportionate amount of time, and that stock prices are not uniformly distributed during the day. Because of the this, we do not believe that stock price returns are normally distributed (learn about the kurtosis of returns in How Do I Know if VWAP Volatility is For Me), which violates one of the principles in Geometric Brownian Motion.
Next Steps
We believe that the calculation of a VWAP volatility is a refined estimate of historical volatility. Given some of the extreme volatility seen in the marketplace today due to influences like algorithmic trading, social media, the rebalancing of institutional investor portfolios, we believe that the closing price can no longer be seen as the most reliable approach for calculating historical volatility. Further, with advances in computational capabilities, we believe that the VWAP volatility should be one of the considered alternatives in selecting your process for estimating volatility.
For an estimate of how the VWAP volatility compares to a traditional historical volatility, please reach out to your Infinite Equity consultant. Please see more research from Infinite Equity at www.VWAPVolatility.com.


