The new executive compensation disclosures under Item 402(v) (“Pay versus Performance”) have created new standardized disclosures that are rich for advanced analytics.
This brief will summarize the mathematics to define a “Sharing Ratio” based on these new standardized disclosures.
As a quick reminder, some of the data items in the new disclosures are:
- Principal Executive Officer (“PEO”) Summary Compensation Table (“SCT”) Total
- PEO Compensation Actually Paid (“CAP”)
- Non-PEO Named Executive Officers (“NEOs”) SCT
- Non-PEO NEOs CAP
- Total Shareholder Return (or “TSR”) illustrated as a $100 investment at the beginning of the reporting period
- Peer TSR illustrated as a $100 investment over a comparable time
(Not shown in the disclosures) Market capitalization of the reporting company from the beginning of the reporting period. Although this doesn’t appear immediately in the disclosures, it is easily accessible in any set of financial data.
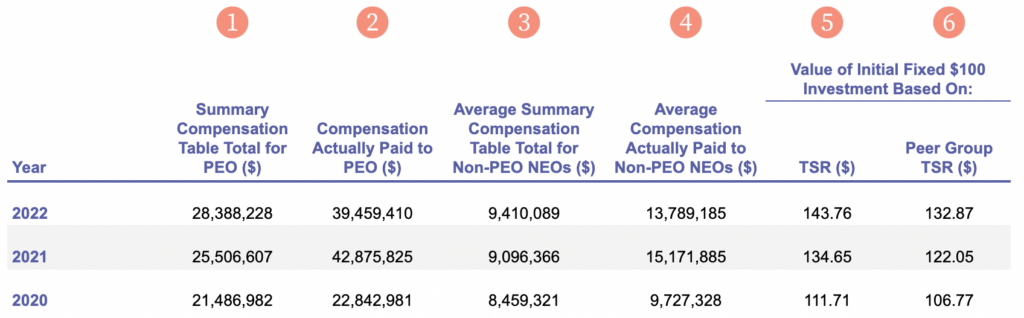
The pay disclosed in the Summary Compensation Table (#1) is generally the “market rate of pay” and a normalized expectation of stock price performance for equity granted. However, investors and the Compensation Committee will generally expect stock price performance to be comparable to market returns, or consistent with the returns of the disclosed Peer TSR disclosed (#6).
How To Develop a Sharing Ratio
Note that the TSR Performance Metrics (#5 and #6) as seen in the Pay vs. Performance table are calculated over the entire reporting period while the compensation measures are annual. To create improved comparisons, it is required to sum the SCT ($75,381,817) and CAP ($105,178,216) numbers. In this example, the PEO has earned Excess CAP (above the SCT) in the amount of $29,796,399.
Further, this sample company started with an initial market capitalization on 12/31/2019 of $190.6 billion. Based on this initial market capitalization, and a 43.76% TSR ($143.76 dollars growing from $100), then the actual company market cap at the end of Year 3 is $274.0B. However, the expected market cap based on peer returns would have been $253.2 (a 32.87% TSR). Therefore, this example company grew market capitalization by an additional $20.8B.
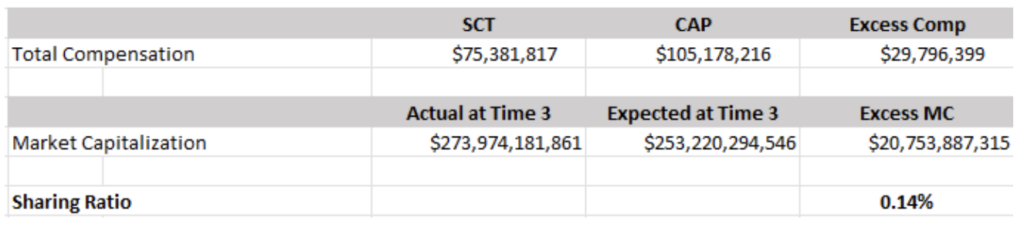
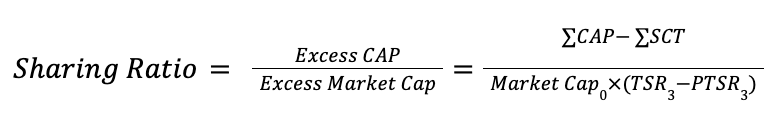
The PEO would therefore be sharing in a fraction of the total Excess Market Cap Growth, $29,796,399 / $20.8B or 0.14%. A similar ratio can be developed for the non-PEO Named Executive Officers. Broadly speaking, a Sharing Ratio can be calculated as follows:
How to Use a Sharing Ratio
The size of the Sharing Ratio is up for debate, and there is greater research behind it, but that is not the focus of this blog. Ultimately, the sharing ratio will change based on many variables, such as the stage of the cycle of the company, industry, and many other variables.
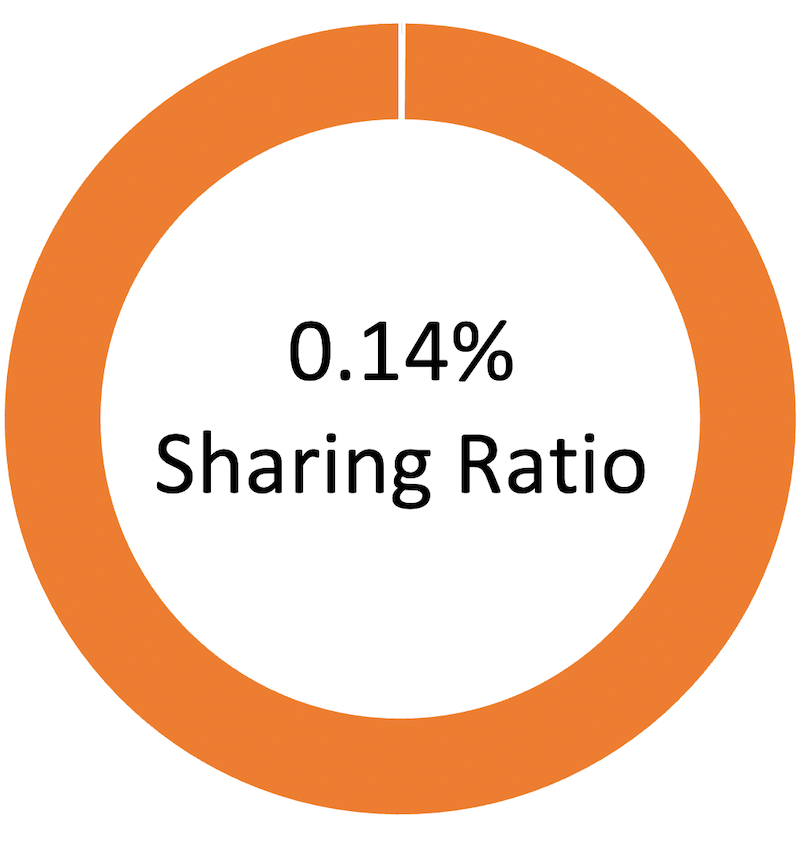
In this single example, the Sharing Ratio is only .14%.
Need more help navigating the complexities of Pay versus Performance and Sharing Ratios?
Let Infinite Equity’s team of industry leaders guide you. We can help you optimize your equity program to achieve your goals while minimizing risk and staying compliant. Contact us to learn more.

The New Rules of Pay Versus Performance

