In the first installment of Infinite Equity’s Five Practical Improvements for Modernizing Executive Compensation Disclosure, we explore combining the Summary Compensation Table with the Pay versus Performance Table Disclosure, CEO Pay Ratio, and 10-K Performance Graph.
The traditional approach to equity compensation reporting is outdated and fragmented – the four independent tables create confusion and redundancy. This should not be a jigsaw puzzle left for stakeholders to piece together from multiple filings and disclosures related to executive pay.
This paper consolidates key elements of these fragmented tables and provides an improved view of executive compensation and performance. We argue that this approach enhances clarity, reduces redundancy, and offers a more investor-friendly understanding of the relationship between executive pay and performance.
The overall purpose of these tables can be summarized as:
“Summary Compensation Table”: Provides a comprehensive overview of the compensation paid to a company’s named executive officers (NEOs), and other top executives. It details various components of compensation, such as salary, bonuses, stock awards, option awards, non-equity incentive plan compensation, pension benefits, and other forms of compensation for the past three years.
“Pay versus Performance Table Disclosure”: Creates a new definition of pay called ‘Compensation Actually Paid’ which represents a composite of both Realizable and Realized Pay. Under the Pay versus Performance rules, equity compensation is marked to market over the life of the award and is considered compensation actually paid up to the point of vesting — at which point ownership transfers to the executive. Any appreciation post-vesting is treated as an investment return rather than compensation.
“10-K Performance Graph”: Presents a graphical comparison of the company’s cumulative total shareholder return (typically over five years) against a broad market index (e.g., S&P 500) and a peer group or industry index. It illustrates how the company’s stock performance compares to relevant benchmarks, helping investors evaluate the company’s financial performance and market competitiveness over time.
“CEO Pay Ratio”: Discloses the ratio of the CEO’s total annual compensation to the median compensation of all other company employees (excluding the CEO). Aims to provide insight into pay equity within the organization, allowing shareholders and stakeholders to assess the fairness and proportionality of executive compensation relative to the broader workforce.
Having four independent, fragmented tables creates the following issues:
- Total Compensation from the Summary Compensation Table is the starting point for the calculation of ‘Compensation Actually Paid’ in the Pay versus Performance Table. Keeping these tables separate may hinder stakeholders’ ability to perform a comprehensive analysis of pay-for-performance alignment, potentially weakening the company’s case for its compensation practices.
- The 10-K Performance Graph is included in the 10-K, not the proxy statement, so referencing or reconciling it with proxy tables requires extra effort from stakeholders. This separation may create a disjointed experience when evaluating performance metrics.
- Despite being required by the SEC, the CEO Pay Ratio remains one of the most marginalized metrics in the proxy statement. It is buried in a separate section, floating in isolation, detached from the Summary Compensation Table. This format creates unnecessary friction in understanding what should be a cohesive narrative.
- Different time measurements between tables create issues with line of sight when drawing comparisons. It stands out to the reader that the Summary Compensation Table only covers three years of history, while the Pay versus Performance Table and 10-K Performance Graph cover five years.
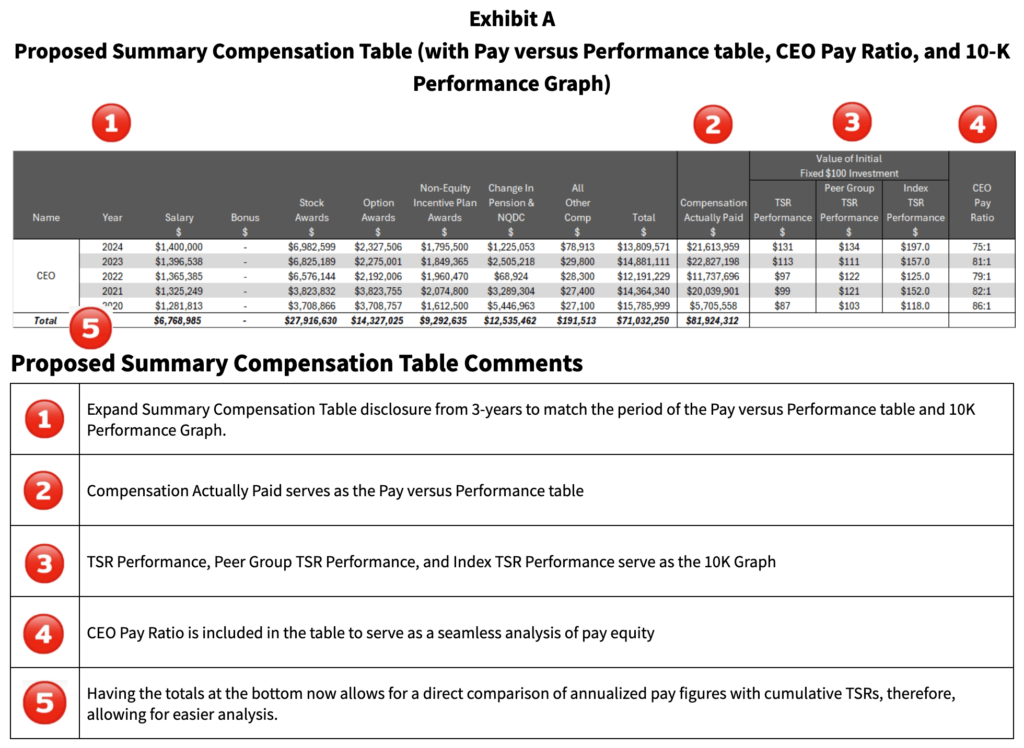
We propose a simple, low-cost enhancement (See Exhibit A) to add the Pay versus Performance table, the 10-K Performance Graph TSRs and the CEO Pay Ratio into the Summary Compensation Table. Companies would retain the ability to provide context through footnotes, explaining fluctuations in the disclosures year-over-year. This encourages more meaningful engagement rather than perfunctory compliance, and would have the following immediate benefits:
- Enhanced Transparency and Accessibility:
Consolidating these metrics into one table provides shareholders with a centralized, comprehensive view of executive compensation, pay equity, and company performance, making it easier to understand the relationship between these factors without navigating multiple sections of the proxy statement or 10-K.
- Improved Comparability:
Presenting executive compensation, pay equity, and performance metrics side-by-side allows stakeholders to directly compare how executive pay aligns with company performance and employee compensation, facilitating better-informed assessments.
- Streamlined Shareholder Analysis:
A unified table reduces the time and effort required for investors to analyze disparate data points, enabling quicker evaluations of whether executive compensation is justified relative to company performance and workforce pay, which could enhance shareholder engagement.
- Clearer Alignment of Pay and Performance:
Integrating the Pay versus Performance data and the 10-K Performance Graph with compensation details highlights the linkage (or lack thereof) between executive rewards and key financial metrics like total shareholder return, reinforcing accountability in corporate governance.
- Simplified Reporting for Companies:
A single table could streamline the preparation and presentation of compensation-related disclosures, potentially reducing redundancy in narrative explanations and improving the efficiency of proxy statement drafting, while still meeting SEC requirements.
- Enhanced Stakeholder Communication:
Combining these elements into one table can create a more compelling and cohesive narrative about the company’s compensation philosophy, pay equity, and performance outcomes, improving communication with investors, analysts, and other stakeholders.
As compensation structures become more performance-based and long-term oriented, the disclosure framework should evolve too. We believe this reimagined Summary Compensation Table would provide a clearer, more aligned, and more useful lens on executive compensation. It is time to move beyond legacy disclosure checkboxes — and build a model that better reflects modern equity compensation practices and investor expectations.
For more information on Infinite Equity’s suggested amendments to the current executive compensation disclosure landscape, refer to the rest of our materials on our website, www.InfiniteEquity.com