The SEC announced the adoption of its new pay versus performance rules, or Item 402(v) on August 25, 2022. A detailed summary of the new rules can be found within our Alert found here.
However, the intent of this shorter brief is to summarize the requirements surrounding the selection of peers and the approach used when constructing and calculating the cumulative TSR of the custom peer index disclosed in the pay versus performance table.
As a reminder, the new rules require that all reporting companies provide either a narrative, graphical or combined narrative and graphical description of the relationship between the company’s cumulative TSR and the cumulative TSR of the selected peer group benchmark. If the company elects to provide a graphical disclosure, then the graphical disclosure must be in compliance with Item 201(e) of Regulation S-K and the cumulative TSR of both the peer group and the company should be measured over the three most recent fiscal years. On a go-forward basis the reporting company will be required to layer on an additional year of performance until the TSR performance comparison encapsulates the most recent five fiscal years. The reporting company may select either a relevant line-of-business disclosed index, typically the index shown in the performance graph disclosed under Regulation S-K, or a group of market-cap weighted peer companies, typically the company’s CD&A peer group.
There are a few items for companies to consider when constructing a market-cap weighted peer index for purposes of comparing cumulative TSR.
- TSR of the constituents should be weighted by market cap at the beginning of each measurement period for which a return is indicated. We interpret this to mean that the weightings must be adjusted at each measurement point, i.e., annually, quarterly or monthly, depending on the granularity selected by the company.
- If the reporting company elects to select a peer group that is not a published index, then the components of the index must be disclosed in a footnote, unless the peers selected were disclosed in a separate filing, in which case a reference to the filing is permissible.
- If the company changes the peer group year-over-year, then the company must disclose in a footnote why the change was made and compare the company’s TSR to both the new and the old group.
These additional challenges and considerations with selecting a custom market-cap weighted peer index are summarized in the example below:
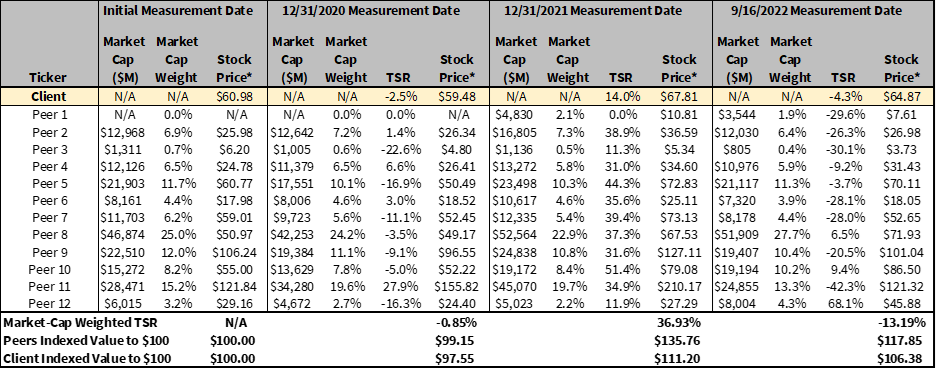
Example: Company ABC uses a custom market-cap weighted index consisting of the company’s twelve CD&A peers. The company measures TSR performance on an annual basis. Therefore, the company will need to adjust the weight of the index at each annual measurement point. An illustrative table of each company’s Market Cap Weighting at the first and last measurement point and, the Market- Cap weighted price of the index over the measurement period from 12-31-2019 through 9-16-2022 is shown below.

The chart above illustrates the cumulative market cap weighted TSR of the peer group, with re-balancing of the market caps annually (in this example on the initial measurement date of 12/31/2019, and then again on 12/31/2020, and ultimately at 12/31/2021).
Note that Peer 1 began trading after the initial Measurement Date. The stock price returns for Peer 1 are incorporated into the Market Cap weighted TSR beginning on the first Measurement Date following Peer 1’s first trading date.
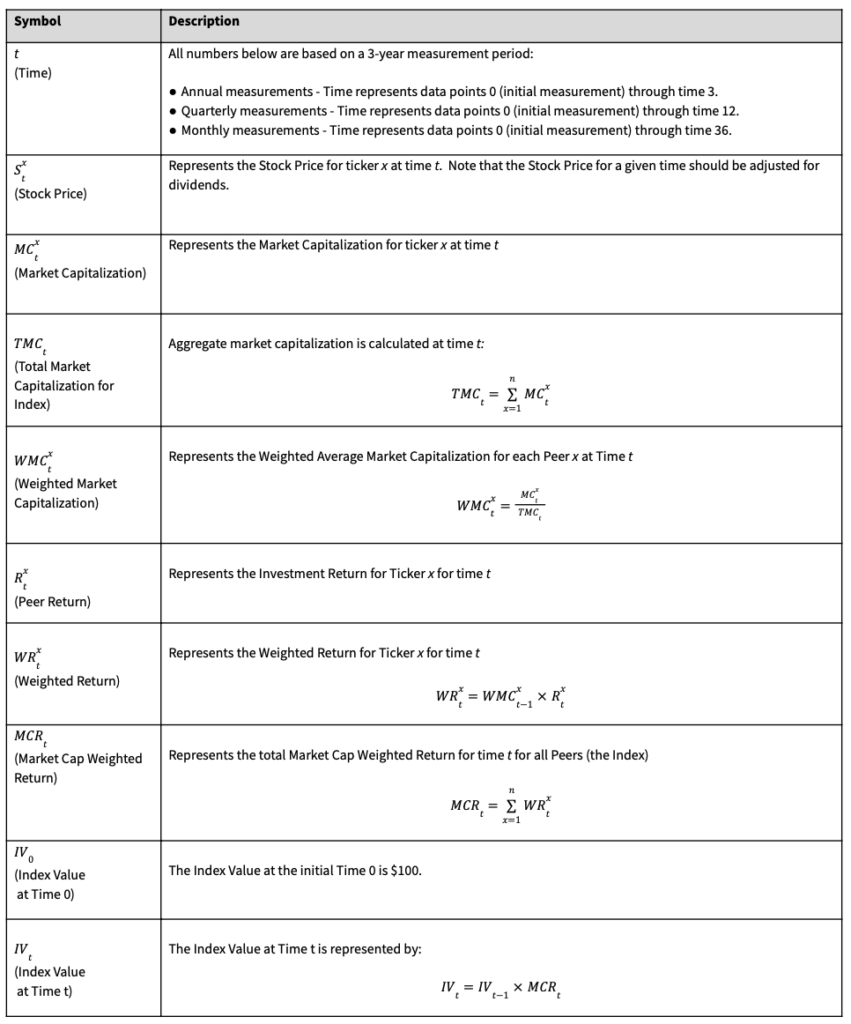
We have also calculated the cumulative TSR based upon Quarterly and Monthly re-balancing of Market Capitalizations (per Questions 5.01 and 5.02 of Item 201 of Regulation S-K). The full mathematics in calculating a Market Capitalization weighted peer group can be found in Appendix A.
| 12/31/2019 | 12/31/2020 | 12/31/2021 | 12/31/2022 | |
| Client Indexed Value to $100 | $100.00 | $97.55 | $111.20 | $106.38 |
| Peers Indexed Value to $100 (Annual re-balancing) | $100.00 | $99.15 | $135.76 | $117.85 |
| Peers Indexed Value to $100 (Quarterly re-balancing) | $100.00 | $99.12 | $135.45 | $117.47 |
| Peers Indexed Value to $100 (Monthly re-balancing) | $100.00 | $99.23 | $136.06 | $117.94 |
Note that the differences between re-balancing Market Capitalizations Annually, Quarterly, or Monthly have only small differences in Index Value, and one approach does not systematically bias the calculation in either direction. Because of this, we feel it is appropriate to use Annual re-balancing for simplicity.
Given the additional calculations and complexities involved when creating a peer index some companies may be best served to select an in-line industry index based on the reasons laid out below:
- Rebalancing and weighting of peers is internally adjusted by the publishers of the index, i.e. no manual rebalancing
- If the peer group changes year over year the company does not need to track TSR performance against both the old and current index
In contrast selecting the CD&A peer group as the comparator group provides increased visibility and alignment with how executive compensation is determined, despite the additional rigor involved. However, ultimately it is up to the company to decide the approach that is best for them.
Infinite Equity continues to examine the new pay for performance rules and how they will impact both the executive and equity compensation community. For more information on the new pay for performance regulations or assistance navigating these changes, reach out to us at Infinite Equity for help.
Appendix A: How to Calculate Market Cap Weighted TSR for Peers 1 through n Peers (“Peer Group” or “Index”)


