Have you ever heard “we use 3-to-1” or “we use 2-to-1” in response to the question about the appropriate ratio for Options to RSUs? The answers are likely reasonable and backed by math or market data… If you work at a public company.
For private companies, applying public-market conversion ratios to RSU and option grants misses a fundamental difference in how those instruments are priced at grant. The math isn’t wrong, the context is.
Start with What Each Instrument Actually Delivers
An RSU delivers one share at vesting equal to the price at that time. An option provides value if the future stock price increases above the strike price set at grant. If the stock doesn’t move, or falls, it expires worthless.
That asymmetry is why public companies grant more options than RSUs for equivalent value. Common ratios applied (e.g., 2-to-1 for higher-volatility stocks up to 3-to-1 for more mature, stable companies) often leverage option pricing models that account for the inherent differences between the two equity vehicles.
But those models assume something critical: the option starts at zero intrinsic value because the strike equals a real, market-determined price. In public companies, that’s true. In private companies, that is rarely true.
Private-Company Options Are Worth More Than They Look
Private companies rarely have a liquid, market-driven price to reference. Instead, private companies may have a mix of “prices” to consider to set option strikes: a recent preferred-round price, secondary market transactions, and the 409A valuation. All reflect a discount relative to what shares would trade for on an open market. The 409A may apply additional adjustments for illiquidity, lack of marketability, and Board judgment, resulting in a price heavily discounted to the preferred price. And that is okay, for a tax exercise.
The practical effect: a private-company option granted “at the money” against the 409A is often already economically in-the-money, the strike discount is baked in due to the prescribed nature of the tax requirements. That built-in value changes the math fundamentally, all else being equal.
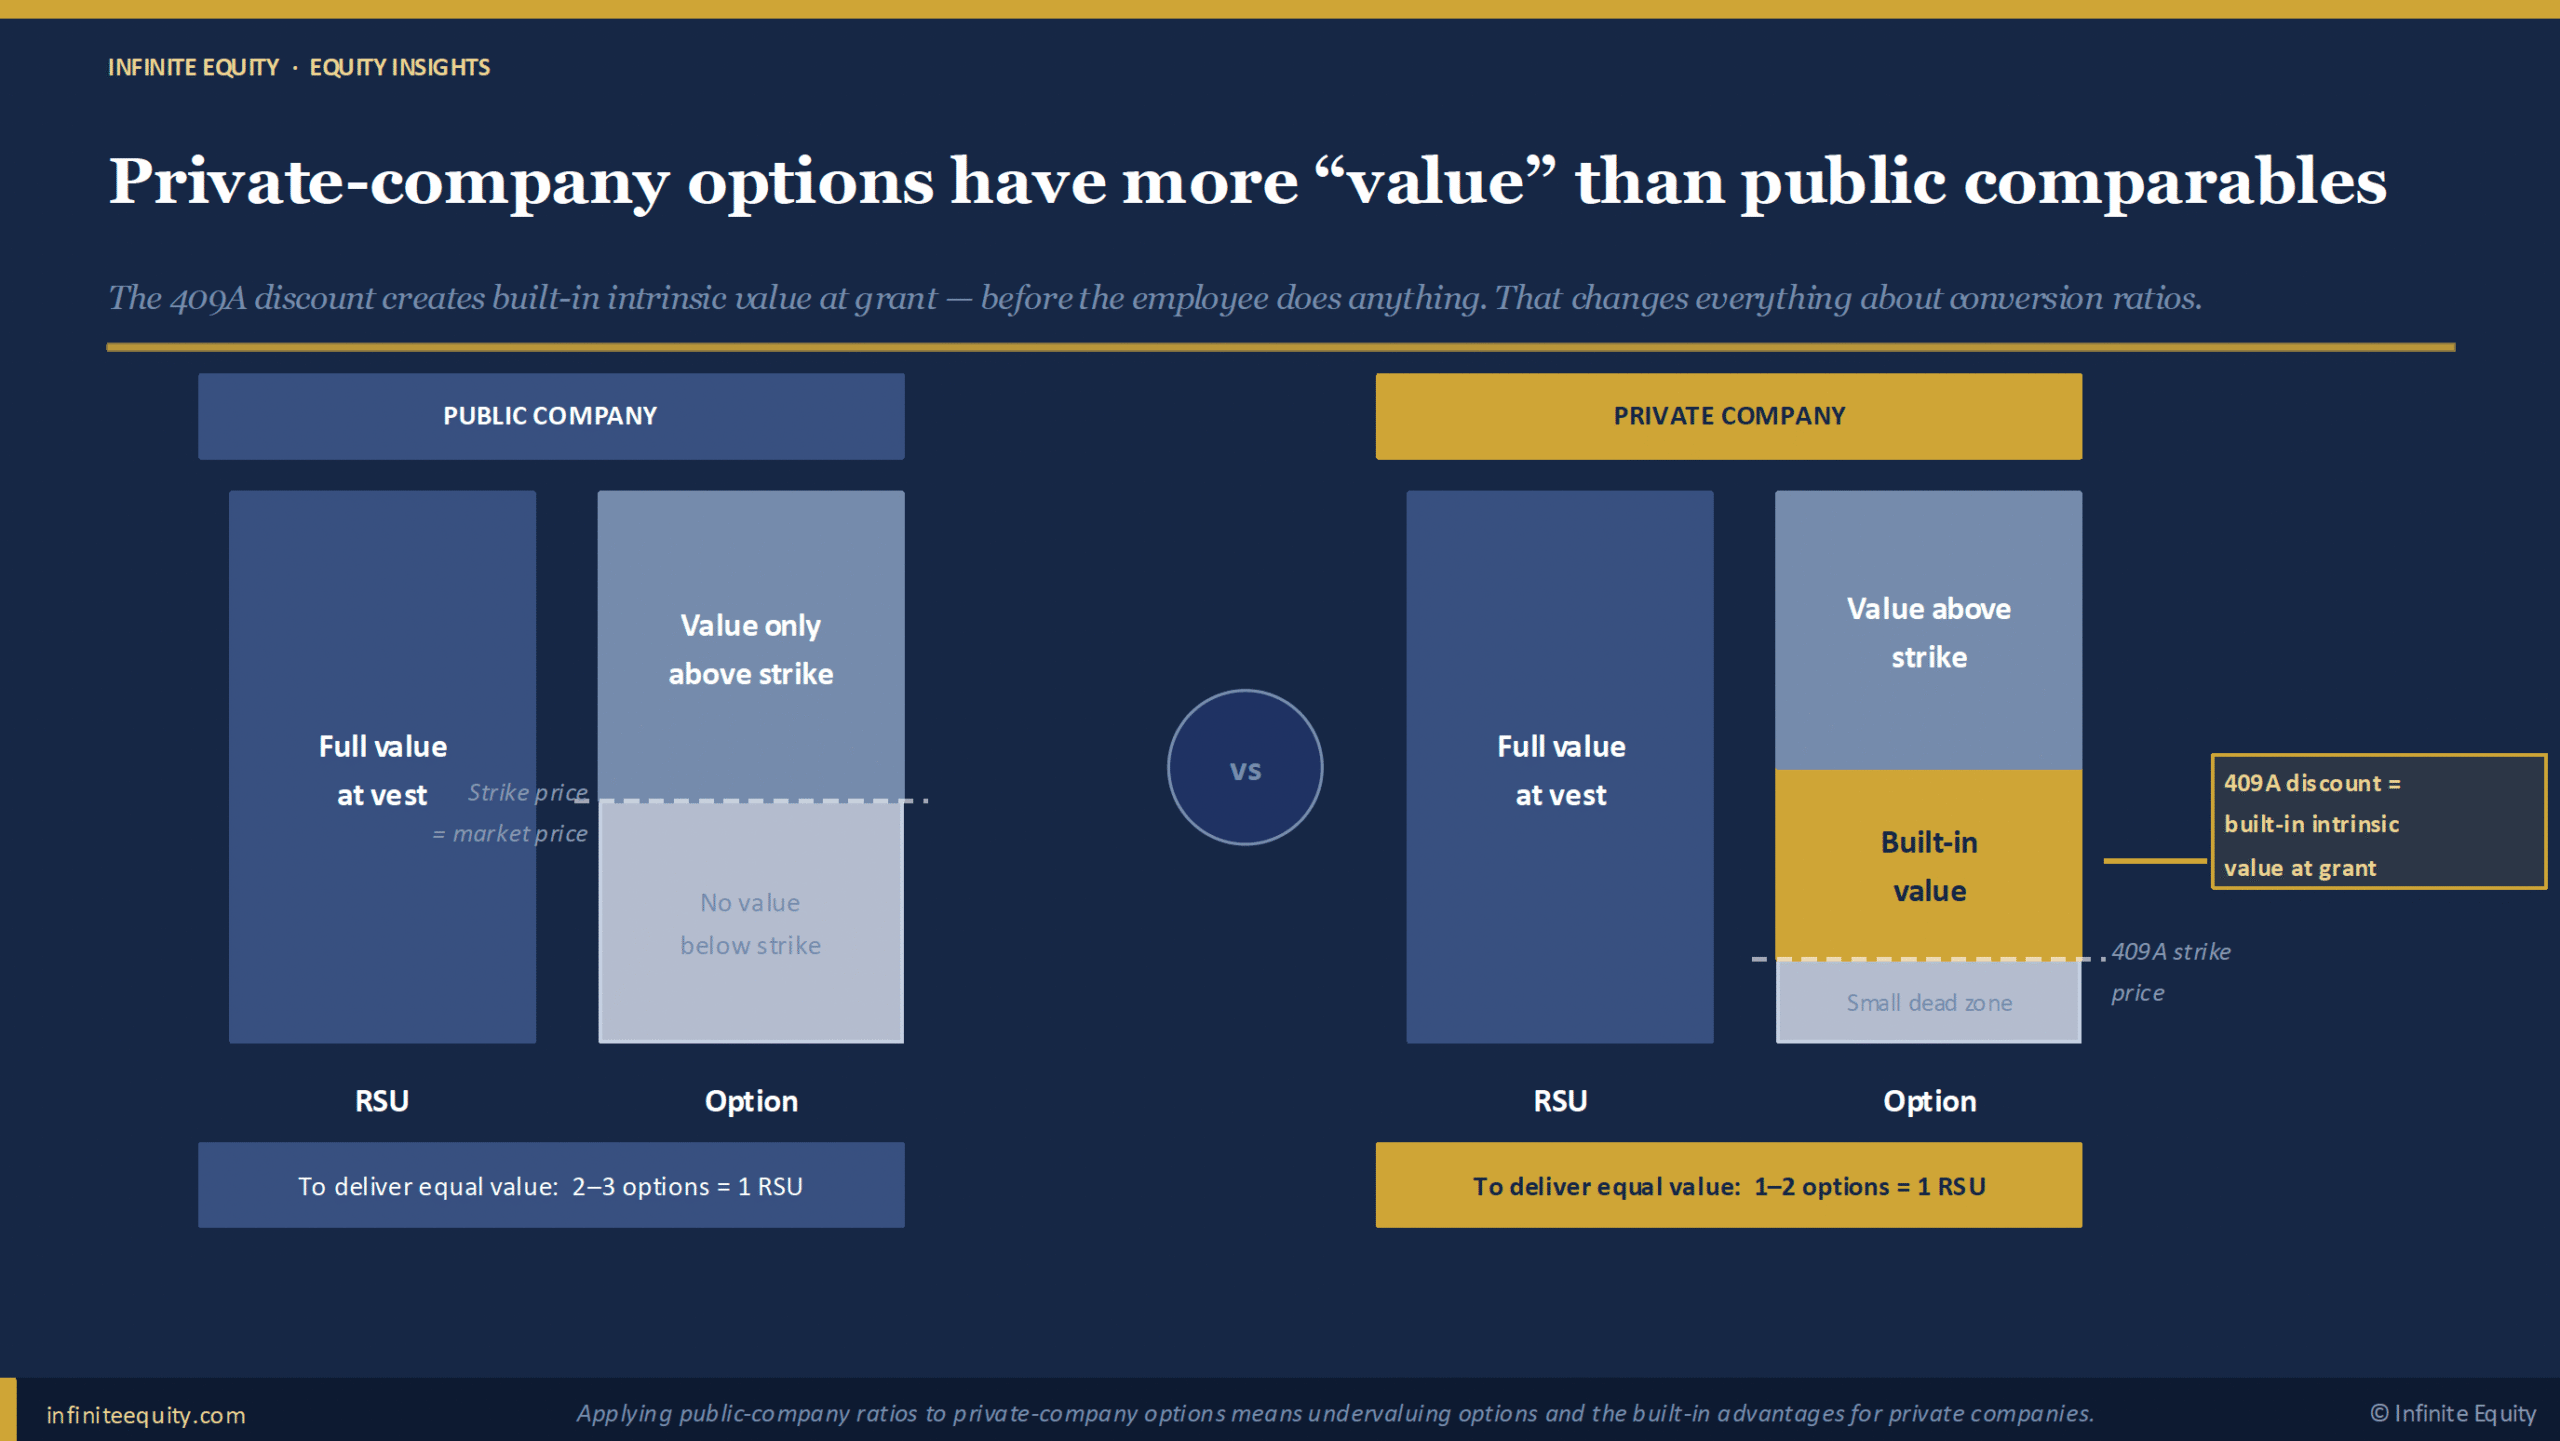
Apply a public-company ratio to a private-company option, and you may be double-counting the future value opportunity. Said another way, private company options are like granting in-the-money stock options for public companies (a violation of 409A).
The Ratio Should Move with Your Stage
The 409A discount decreases as a company approaches a public event, which means there’s no single right ratio. Your stage gives you a starting point, but the right ratio still depends on your company’s specific facts:
| Stage | Conditions | Discount | Ratio |
|---|---|---|---|
| Early stage | Deep 409A discount often driven by big assumptions of outcomes or heavier judgment; long runway to liquidity | ~90%+ | ~1 to 1 |
| Mid stage | Discount more reflective of strategy timing and time to desired successful exits; 2–4 years to liquidity; recent preferred rounds to reference | ~50% | ~1.25 to1 |
| Late stage | Discount converges and is based on probability-weighted outcomes that reflect strategy in motion | ~20% | ~1.5 to 1 |
| Pre-IPO | Near-market pricing; short timeline | <10% | ~1.8 to 1 |
Note the “Ratio” question we are discussing rarely comes up, nor is it appropriate, for Early and Mid Stage private companies. The above chart is shown to drive home an appreciation for how stage of growth and time to exit impact the discount and implied ratio.
Three Questions Before You Trust Any Benchmark
Most conversion-ratio mistakes don’t come from bad math. They come from applying benchmarks without understanding what’s in them. Survey data blends companies at different stages, using different instruments, reported in different units.
What’s actually in the survey? Panels that blend early-stage options reported in percentage-of-ownership with late-stage, dollar-denominated RSU grants can produce ratios that are significantly off for your situation. Before anchoring to any number, ask which stages are represented and how grants are measured.
How volatile is your company, really? Higher volatility increases option value, which means fewer options per RSU are needed, and the ratio goes down. Most private companies borrow an industry proxy rather than calculating their own. Make sure the proxy is honest; a 25% volatility assumption for a high-growth company may not reflect reality.
How close is your liquidity event? Time value compresses as the path to IPO or acquisition shortens. An option three years from liquidity has meaningfully more time value than one twelve months out. As that timeline shrinks, the ratio should drift up.
What a Defensible Ratio Looks Like
A defensible approach has three pieces:
State the assumptions. Tie your ratio to your current 409A-to-preferred discount, your expected time to liquidity, and your volatility assumption. Don’t quote a number without naming what it depends on.
Disclose the benchmark. Say where the data came from, what instruments are in it, and what unit it’s reported in. A comp committee can’t evaluate the ratio without knowing what it’s converting from.
Plan to revisit. Build in a refresh cadence annually or biannually, or whenever a material 409A change occurs. As conditions evolve, the ratio should too.
The Takeaway
There is no universally appropriate conversion ratio, especially for private companies. Anyone who hands you a number without that context is giving you a rule of thumb, not a methodology.
The good news: once you frame the decision this way, the ratio follows from the assumptions. The work isn’t the math. It’s in understanding where the information comes from and the specifics of your situation.
Every private company’s situation is different. The right conversion ratio depends on your 409A discount, your time to liquidity, and the specific instruments in your plan. If you’re working through a ratio decision or building out your equity program, the Infinite Equity team can help. Contact us here.